
Note
Go to the end to download the full example code
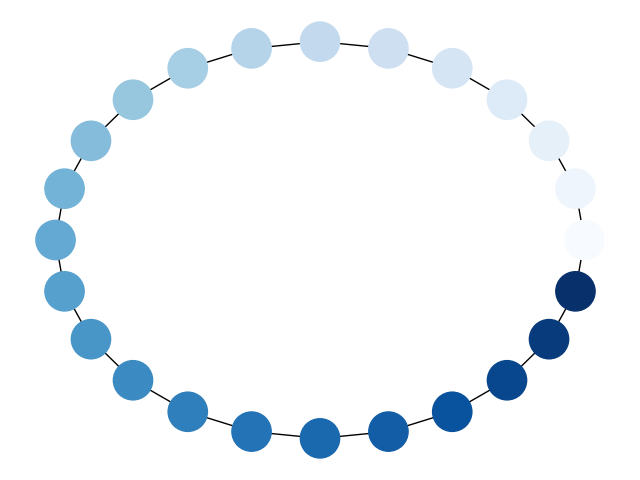
Node Colormap#
Draw a graph with matplotlib, color by degree.
import matplotlib.pyplot as plt
import networkx as nx

G = nx.cycle_graph(24)
pos = nx.circular_layout(G)
nx.draw(G, pos, node_color=range(24), node_size=800, cmap=plt.cm.Blues)
plt.show()
Total running time of the script: (0 minutes 0.049 seconds)