
Note
Go to the end to download the full example code
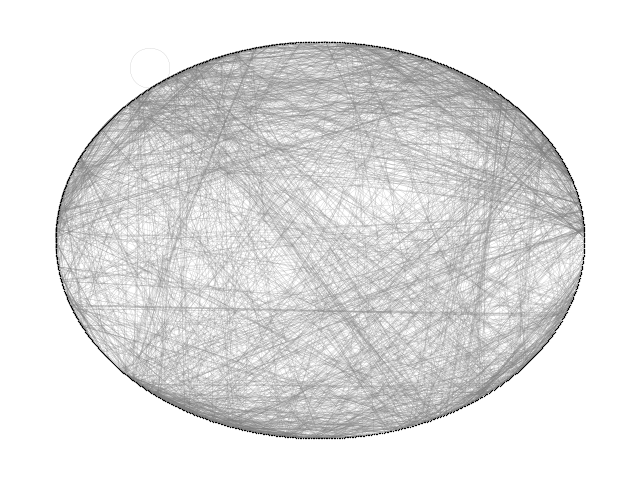
Roget#
Build a directed graph of 1022 categories and 5075 cross-references as defined in the 1879 version of Roget’s Thesaurus. This example is described in Section 1.2 of
Donald E. Knuth, “The Stanford GraphBase: A Platform for Combinatorial Computing”, ACM Press, New York, 1993. http://www-cs-faculty.stanford.edu/~knuth/sgb.html
Note that one of the 5075 cross references is a self loop yet it is included in
the graph built here because the standard networkx DiGraph class allows self
loops. (cf. 400pungency:400 401 403 405).
The data file can be found at:
skipping self loop 400 400
Loaded roget_dat.txt containing 1022 categories.
DiGraph with 1022 nodes and 5075 edges
21 connected components
import gzip
import re
import sys

import matplotlib.pyplot as plt
import networkx as nx


def roget_graph():
    """Return the thesaurus graph from the roget.dat example in
    the Stanford Graph Base.
    """
    # open file roget_dat.txt.gz
    fh = gzip.open("roget_dat.txt.gz", "r")

    G = nx.DiGraph()

    for line in fh.readlines():
        line = line.decode()
        if line.startswith("*"):  # skip comments
            continue
        if line.startswith(" "):  # this is a continuation line, append
            line = oldline + line
        if line.endswith("\\\n"):  # continuation line, buffer, goto next
            oldline = line.strip("\\\n")
            continue

        (headname, tails) = line.split(":")

        # head
        numfind = re.compile(r"^\d+")  # re to find the number of this word
        head = numfind.findall(headname)[0]  # get the number

        G.add_node(head)

        for tail in tails.split():
            if head == tail:
                print("skipping self loop", head, tail, file=sys.stderr)
            G.add_edge(head, tail)

    return G


G = roget_graph()
print("Loaded roget_dat.txt containing 1022 categories.")
print(G)
UG = G.to_undirected()
print(nx.number_connected_components(UG), "connected components")

options = {
    "node_color": "black",
    "node_size": 1,
    "edge_color": "gray",
    "linewidths": 0,
    "width": 0.1,
}
nx.draw_circular(UG, **options)
plt.show()
Total running time of the script: (0 minutes 0.202 seconds)