
Note
Go to the end to download the full example code
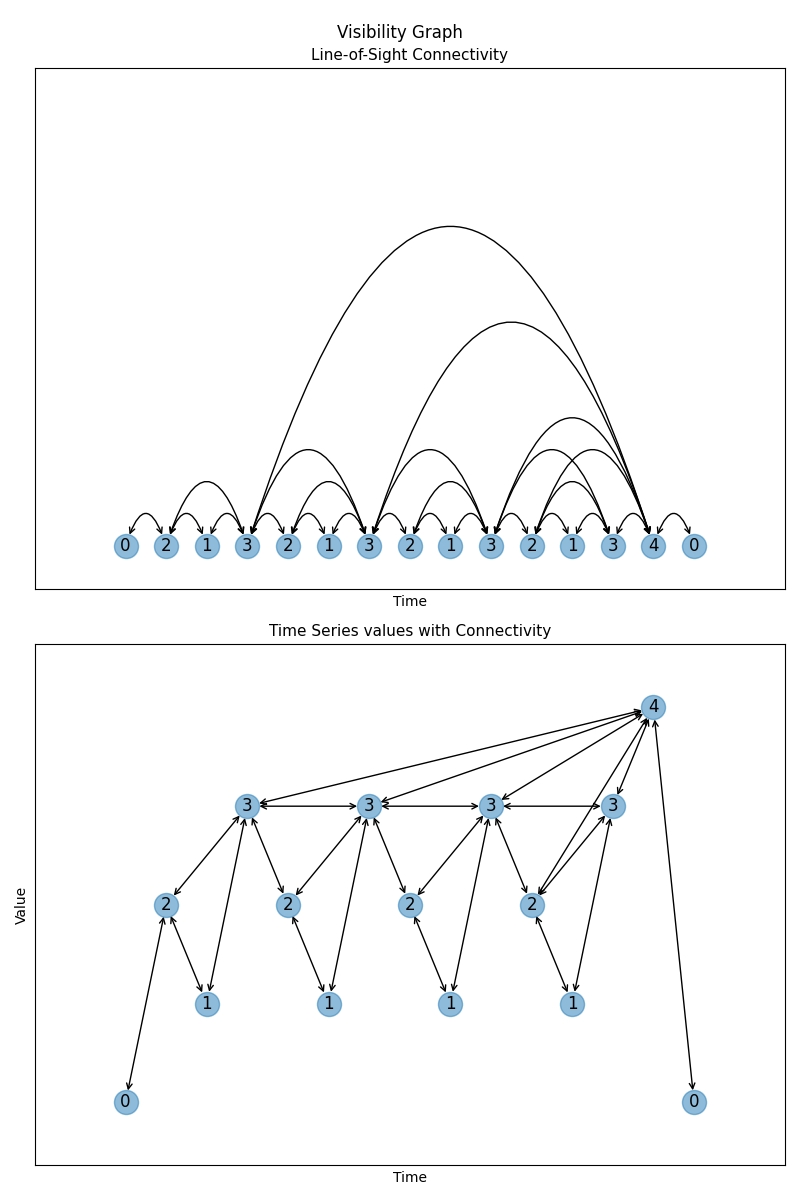
Visibility Graph#
Visibility Graph constructed from a time series
from matplotlib import pyplot as plt

import networkx as nx

time_series = [0, 2, 1, 3, 2, 1, 3, 2, 1, 3, 2, 1, 3, 4, 0]
# or
# import random
# time_series = [random.randint(1, 10) for i in range(10)]

G = nx.visibility_graph(time_series)

labels = nx.get_node_attributes(G, "value")

fig, all_axes = plt.subplots(2, 1, num="Visibility Graph", figsize=(8, 12))
axs = all_axes.flat

layouts_params = {
    # a layout emphasizing the line-of-sight connectivity
    "Line-of-Sight Connectivity": {
        "pos": {x: (x, 0) for x in range(len(time_series))},
        "connectionstyle": "arc3,rad=-1.57079632679",
    },
    # a layout showcasing the time series values
    "Time Series values with Connectivity": {
        "pos": {i: (i, v) for i, v in enumerate(time_series)}
    },
}

for i, (name, params) in enumerate(layouts_params.items()):
    axs[i].title.set_text(name)
    axs[i].title.set_size(11)
    axs[i].set_xlabel("Time", size=10)
    axs[i].margins(0.10)
    nx.draw_networkx_nodes(G, params.get("pos"), ax=axs[i], alpha=0.5)
    nx.draw_networkx_labels(G, params.get("pos"), ax=axs[i], labels=labels)
    nx.draw_networkx_edges(
        G, **params, ax=axs[i], arrows=True, arrowstyle="<->", arrowsize=10
    )

axs[1].set_ylabel("Value", size=10)

fig.suptitle("Visibility Graph")
fig.tight_layout()
plt.show()
Total running time of the script: (0 minutes 0.347 seconds)