
Note
Go to the end to download the full example code
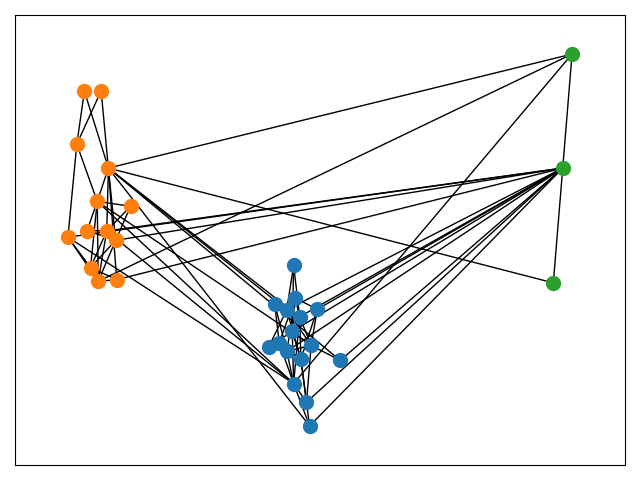
Cluster Layout#
This example illustrates how to combine multiple layouts to visualize node clusters.
The approach used here can be generalized to visualize hierarchical clustering e.g. clusters-of-clusters of nodes by combining layouts with varying scale factors.
import networkx as nx
import matplotlib.pyplot as plt

G = nx.davis_southern_women_graph()  # Example graph
communities = nx.community.greedy_modularity_communities(G)

# Compute positions for the node clusters as if they were themselves nodes in a
# supergraph using a larger scale factor
supergraph = nx.cycle_graph(len(communities))
superpos = nx.spring_layout(G, scale=50, seed=429)

# Use the "supernode" positions as the center of each node cluster
centers = list(superpos.values())
pos = {}
for center, comm in zip(centers, communities):
    pos.update(nx.spring_layout(nx.subgraph(G, comm), center=center, seed=1430))

# Nodes colored by cluster
for nodes, clr in zip(communities, ("tab:blue", "tab:orange", "tab:green")):
    nx.draw_networkx_nodes(G, pos=pos, nodelist=nodes, node_color=clr, node_size=100)
nx.draw_networkx_edges(G, pos=pos)

plt.tight_layout()
plt.show()
Total running time of the script: (0 minutes 0.133 seconds)